

StockCharts.com Review
Product Name: StockCharts.com
Product Description: StockCharts.com is a web-based stock charting package. The website is run by President and CEO Chip Anderson. Much of the site’s popularity can be attributed to StockCharts’ free service, which allows traders to save images of charts that have the StockCharts watermark on them.
-
Charts
-
Scanners
-
Features
-
Value
Summary
StockCharts.com is one of the most popular free charting services. They offer a wide range of charts, technical indicators, and trading tools. Most traders are familiar with StockCharts’ free services. Is the paid version worth it? Read this review to find out.
About StockCharts.com
StockCharts.com is a web-based charting platform for traders. It offers a wide range of chart types, including unusual charts like point and figure charts and relative strength charts. It also offers educational articles, pattern-based alerts, and a technical stock scanner.
Are these award-winning charting tools right for you? Keep reading our StockCharts.com review to find out.
StockCharts.com Pricing
StockCharts.com Free Plan
StockCharts.com used to be renowned for its free charts, which offered access to virtually all of the platform’s charts and tools but lacked real-time data. However, the free plan has changed recently so that it’s now much more limited.
With the new free plan, there’s still no real-time data and you’re limited to three technical indicators and three overlays per chart. You can’t create scans or set up alerts with the free charting tools. You also can’t view intraday charts.
StockCharts.com Premium Plans
There are 3 paid options to choose from.
The Basic plan costs $19.95 per month and offers plenty of functionality for most traders. You get real-time data, intraday charts, up to 25 technical indicators and 25 overlays per chart, and the ability to save chart templates. The main limitation is that you can only save one custom scan and set up one technical alert at a time.

The Extra plan costs $29.95 per month and enables you to create up to 200 custom scans and set up 100 alerts. You can also create up to 25 multi-chart layouts.
The Pro plan costs $49.95 per month and gives you access to historical price data as far back as 1900 (compared to historical data to 1980 for the other plans). You also get more saved scans and alerts.
StockCharts.com Features
Charts
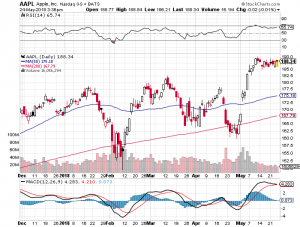
The main thing you get from StockCharts.com is, of course, stock charts. The platform has standard candlestick charts along with a wide range of unique charts that can help you visualize price action in different ways.
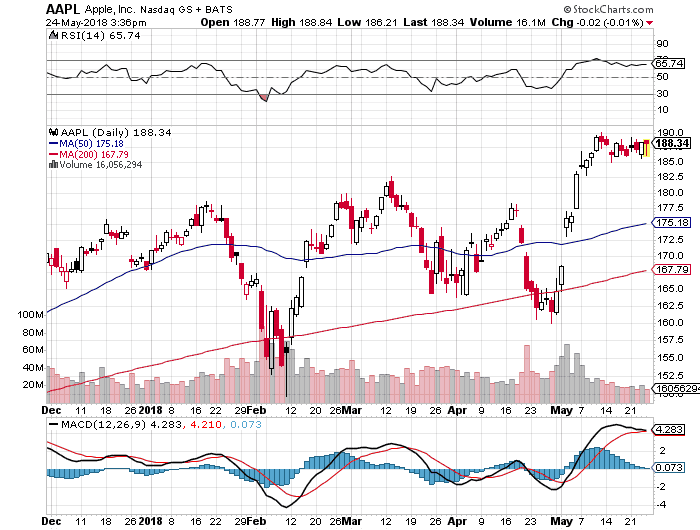
Some of the chart types that StockCharts.com offers include point and figure charts and heatmaps. Performance charts let you compare price performance across up to 12 tickers, while the CandleGlance display lets you put up to 12 miniature candlestick charts on a single page.
One type of specialty chart that’s especially helpful for momentum traders is the Relative Rotation Graph chart. It shows the relative strength of a group of stocks compared to a given benchmark over a given lookback period. The chart breaks tickers into leading, lagging, improving, and weakening, making it easy for traders to identify momentum trading candidates.
🏆 Top Rated Services 🏆
Our team has reviewed over 300 services. These are our favorites:|
📈 Best Day Trading Service Investors Underground 🎯 Best Stock Scanner Trade Ideas 📉 Best Stock Charts TradingView |
💰 Best Stock Picking Service Motley Fool 📱 Best Mobile Broker Webull 📊 Best for Stock Research Seeking Alpha |

Another chart that isn’t often included in other platforms is the Seasonality chart. This chart shows the historical trend for the stock performance for each month of the year. You can additionally compare stocks to each other.

One thing to note about StockCharts.com is that most of the stock charts are static images, not interactive displays. That means you can’t zoom in or out or enable and disable indicators on the fly. Each time you want to change the time frame, lookback period, or indicators, you must change all of the settings and generate a new chart image. That said, StockCharts.com does have an interactive charting tool for candlestick charts.
User-Defined Indexes
StockCharts.com lets you upload .csv data and create a chart out of it. The neat part of this is that you can apply any of the platform’s technical indicators or overlays to the data.
This can be interesting if you want to, say, track the moving average of earnings beats and misses for a company over time. It’s not an especially practical feature for most users, but it’s pretty unique.
Stock Scanner
StockCharts.com comes with dozens of pre-defined scans based on technical indicators, candlestick patterns, and point and figure patterns. These are a great starting point for finding trade ideas since you can quickly pull up a list of stocks with, for example, a bullish MACD crossover or a bullish engulfing pattern.
In addition, StockCharts.com lets you build custom scans using a relatively straightforward coding language. This isn’t as easy as having a scanner with drop-down options, like what the FinViz scanner offers, but it’s so much more customizable. Considering that you can scan for candlestick patterns, this is one of the more powerful technical stock scanners we’ve tested.

Technical Alerts
You can also use StockCharts.com’s scripting language to create technicals-based alerts. For example, you can create an alert for when a ticker has a bullish MACD crossover, an RSI below 70, and a bullish candlestick pattern.
The customizability of these alerts makes them really powerful and a highlight of the StockCharts.com platform.
ChartSchool
StockCharts.com features an educational section called ChartSchool that’s available to both free and paid users.
ChartSchool features in-depth guides on technical analysis and charting. Categories include:
- Analyzing Charts
- Technical Indicators
- Candlestick Patterns
- Scanning for Stocks
Every guide offers a detailed explanation of the key topic, backed by annotated charts and graphics.
This is one of the most impressive parts of StockCharts.com. The guides do a terrific job breaking down complex technical indicators and candlestick patterns and how to put them to use while trading. Regardless of whether you sign up for a StockCharts.com membership, new traders should definitely lean on the ChartSchool guides to learn how to harness technical analysis.
Additional Research
StockCharts.com members get access to daily technical analysis reports from StockCharts.com staff, as well as Decision Point. This includes:
- Daily market summary
- Daily sector summary
- Daily industry summary
- SCTR reports (SCTR is StockCharts’ proprietary technical ranking algorithm)
- Ticker Cloud (Top 200 most popular tickers on StockCharts)
- DecisionPoint chart gallery
Customization and Layout
StockCharts.com is very customizable, enabling you to create custom chart templates, multi-chart layouts, and more. You can also take notes directly on charts and come back to them later.
The StockCharts.com dashboard is also worth noting. It offers an overview of your watchlists, alerts, and scans, plus highlights the biggest movers in the market each day. It’s nothing groundbreaking, but the dashboard is well-designed and helps make StockCharts.com that much better.
🏆 Top Rated Services 🏆
Our team has reviewed over 300 services. These are our favorites:|
📈 Best Day Trading Service Investors Underground 🎯 Best Stock Scanner Trade Ideas 📉 Best Stock Charts TradingView |
💰 Best Stock Picking Service Motley Fool 📱 Best Mobile Broker Webull 📊 Best for Stock Research Seeking Alpha |

Is StockCharts.com Better Than the Competition?
A membership to StockCharts.com definitely has merit, but this depends on what type of trader or investor you are. The charts and scanning tools seem best-suited for swing traders and short-term investors. What sets them apart is the ability to scan for candlestick patterns and technical indicators that typically change on slightly longer timescales than day traders are interested in.
The platform would be especially good for O’Neill style relative strength traders. StockCharts.com You can plot the relative strength trends of multiple stocks at once and compare them using Relative Rotation Graphs.
The multiple analysis tools for computing relative strength and seasonality are also great for positional traders and medium-term investors. StockCharts.com doesn’t offer any fundamental analysis, but it could work well paired with a platform like Stock Rover to plan out entries for fundamental-based trade ideas.
Day traders are more likely to get more value out of a charting platform like TradingView. There’s more support for intraday analysis, plus integrations for signals services and chart trading. The TradingView interface also feels more modern.
Another major difference is that TradingView lets you create your own custom indicators and overlays. You can’t do that with StockCharts.com, although most traders won’t find the existing technical tools to be lacking.
StockCharts.com Pros and Cons
Pros
- Wide range of charts including candlestick, point and figure, and performance
- Relative Rotation Graph charts show momentum across multiple tickers
- Highly customizable stock scanner and technical-based alerts
- Outstanding educational guides for technical analysis
Cons
- Feels outdated compared to charting platforms like TradingView
- Most chart types are not dynamic charts


Customer service will not respond for refunding acct.
Charting PERIOD (weekly, daily, hourly) are preset and user does not have the choice of creating own time period (i.e 20 minutes).
Their scanning engine needs a lot of improvement – it’s a miss and hit type.
Streaming data sometimes bottleneck. Overall it is good but not flawless.
Couple months ago I bought special service for 14 months from StockCharts.com . At the beginning everything was fine. But now, i.e., in September) I am not able to login. I have sent them several messages (at least 3) but I have not received any response from them.
“My main gripe with StockCharts is that instead of a dynamic chart, you deal with images. That means no zooming in/out or enabling/disabling indicators on the fly. Each time you want to change the time frame, lookback period, or indicators, you must change all of the settings and generate a new chart image.”
what the hell??? stockcharts is nearly USELESS then as a real-time trading platform!
thanks for that information. i was debating whether to go with tradingview or stockcharts and it looks like there’s literally no reason to go with stockcharts…
Try StockCharts ACP which has dynamic charts.
I love the ACP charting on stock charts.com, especially when it comes to indicators overlays! the website is my savior! I was unable to be profitable until stock charts started their ACP feature! everyone need to check it out
Good luck getting someone in tech support to respond to your email.
I have been trying to fix some issues with my scans. but my emails go unanswered.
And there is no way to contact anyone to complain.
Used to be a good program.
I am sick to death of stockcharts.com. I have been a subscriber for a very long time and this is the last renewal for me. The final straw was this year when they “new and improved” their scan features which resulted in features that users ACTUALLY USED EVERYDAY being dumped without warning. How, exactly is that helpful? This is not the first time this has happened and I cannot be bothered to put anymore effort into this screw your current users mindset.