

MultiCharts Review
-
Price
-
Ease of Use
-
Charting
-
Strategy Development
Summary
Are you an advanced trader in the market for a new charting and technical analysis platform? MultiCharts might be what you’re looking for. MultiCharts offers its users a variety of tools including PowerLanguage and market replay. Is MultiCharts really all is says, though? Read our thorough review to get an in-depth look at MultiCharts.
About MultiCharts
MultiCharts is a comprehensive charting and technical analysis platform for advanced traders. In addition to providing traders with high-definition charts and a wide variety of technical indicators, MultiCharts offers advanced features like portfolio backtesting, market replay, and a PowerLanguage programming interface. Although MultiCharts is somewhat expensive compared to competing analysis platforms, the software can be well worth the cost for serious traders who want to develop and optimize new trading strategies.
Pricing Options
MultiCharts is available as a subscription software, with subscriptions ranging from 3 months to unlimited. A three-month subscription costs $297, a one-year subscription costs $797, and a lifetime subscription costs $1497. These subscription costs are somewhat higher than costs for comparable platforms from NinjaTrader ($999 for a lifetime subscription) and TradeStation (free), but MultiCharts does not charge commissions on trades placed through the software.
MultiCharts offers a free 30-day trial to test out the platform.
MultiCharts Features
Charting
The charting features of MultiCharts are on par with platforms like ThinkorSwim and TradeStation – which is to say these charts are highly functional and customizable. To start, the charts are in incredibly high definition. It’s easy to see thin indicator lines and tick marks clearly, allowing you to keep multiple charts open on a workspace without losing clarity.

Charts are easy to customize, with most options available from a drop-down menu with a simple right click on the chart. You can completely edit the format, style, and coloring of individual charts, as well as change the default styles throughout the platform. MultiCharts offers hundreds of built-in indicators, although unfortunately the indicator list isn’t searchable. Editing indicators is also straightforward, and there are settings for how often indicators and chart studies should be recalculated. Of course, a suite of drawing tools is also available for on-chart analysis and annotation.

PowerLanguage
MultiCharts’ PowerLanguage programming interface is directly derived from the EasyLanguage programming pioneered by TradeStation and offers much of the same functionality. With the PowerLanguage editor, you can create new functions, indicators, and automated trading strategies. The editor is easy to use, with the ability to display multiple scripts on a side-by-side windows. However, building on the code for existing indicators and functions can be made more difficult by the fact that there is no way to search existing functions.

Stock Scanner
The stock scanner is perhaps one of the most attractive features of MultiCharts for active traders, since scans can be set to automatically update at set intervals down to one minute. Scans are simple to set up and you have the entire indicator and signal library of MultiCharts to develop filters from, as well as your own custom functions and indicators built using PowerLanguage.
The results display of the MultiCharts scanning window is also quite impressive. You’ll find tabulated information about all of the indicators you filtered based upon, and the stock results can be ordered based on any of these data fields. Better yet, you can expand any individual stock in the results list into a full chart with just a single click.

Market Replay
Another useful feature of MultiCharts is the ability to replay market action at the end of each day. Replay can be done at the resolution of individual ticks, or on the order of minutes, hours, or days. Fast-forward and fast-reverse controls give you the ability to skip over periods of slow trading. Helpfully, it’s possible to conduct a market replay over multiple charts at once – which means you can look at multiple charts for a single stock or for multiple, potentially correlated stocks all on a single playback window.
🏆 Top Rated Services 🏆
Our team has reviewed over 300 services. These are our favorites:|
📈 Best Day Trading Service Investors Underground 🎯 Best Stock Scanner Trade Ideas 📉 Best Stock Charts TradingView |
💰 Best Stock Picking Service Motley Fool 📱 Best Mobile Broker Webull 📊 Best for Stock Research Seeking Alpha |

Strategy Backtesting
Backtesting is one of the most important features of MultiCharts and one of the primary reasons to pay for this service over using TradeStation. MultiCharts backtesting is significantly faster than TradeStation thanks to the platform’s ability to use multiple CPUs and all of your computer’s RAM (on Windows x64 machines).
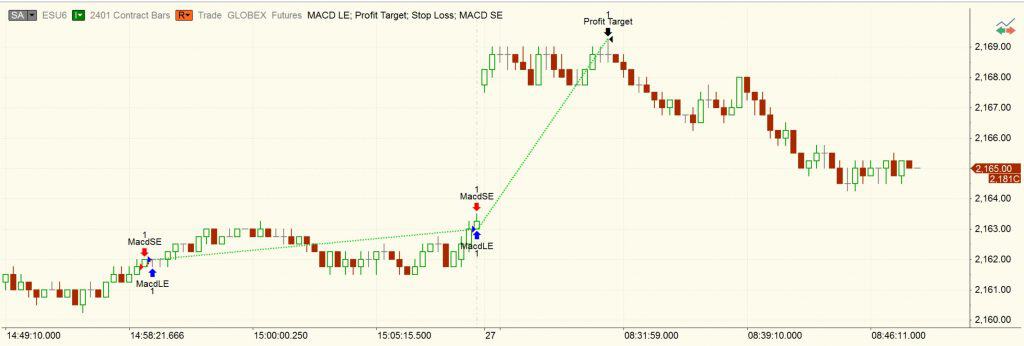
In addition, MultiCharts applies the same customization available in its live charts to backtesting, which helps immensely with visually following the results of your backtests. For example, you can connect signaled exits to signaled entries with a dotted line, and change the color of that line according to whether the trade was profitable or not. Furthermore, multi-timeframe analysis is straightforward and MultiCharts’ Bar Magnifier function allows you to display minute and hour charts while still testing on a tick-by-tick basis.
Compatible Brokerages
MultiCharts is compatible with Interactive Brokers, Gain Capital, and many other high-speed brokerages. Depending on your brokerage, data may be instantaneous or there may be up to a one second delay. Keep in mind that you will need access to one of MultiCharts’ compatible brokerages in order to load exchange data on the platform.
Customization and Layout
MultiCharts is highly customizable, both in individual windows and in entire workspaces. This means that you can modify the MultiCharts layout to work for you, then save that custom layout as the new default. The MultiCharts menu is relatively straightforward, although since the program uses symbols rather than words it takes some time to figure out where all of the backtesting, scanning, and charting functions are. Otherwise, the fact that right-clicking on most windows provides you with a list of all available options makes MultiCharts relatively intuitive to use.

MultiCharts Platform Differentiators
MultiCharts is directly competing with alternative technical analysis and strategy development platforms like TradeStation and NinjaTrader. MultiCharts and TradeStation are in fact highly similar in many ways, including the use of TradeStation’s EasyLanguage programming interface (called PowerLanguage in MultiCharts with only slight modifications). What MultiCharts offers beyond TradeStation is a more intuitive and user-friendly interface that allows for rapid charting and analysis during live trading. On top of that, MultiCharts offers some advantages for backtesting, such as multi-threading and highly interactive charting features. Another reason to opt for MultiCharts is the market replay function, which is not available in TradeStation and is more advanced than a similar replay feature found in NinjaTrader.
What Type of Trader is MultiCharts Best For?
MultiCharts is designed for active day and intra-week traders who want to develop and optimize profitable trading strategies. The platform is designed with advanced traders who already have working strategies in mind, since these are the traders who will most benefit from the market replay, backtesting, and PowerLanguage programming features. While the charting and scanning tools in MultiCharts are exceptional, traders who are not yet ready to move up to using MultiCharts to develop complex trading strategies will be better off with the free charts and scanning features in a program like ThinkorSwim.
Pros
- Highly advanced technical analysis platform for developing trading strategies
- High-resolution charts with hundreds of included indicators and signals
- PowerLanguage programming interface to develop custom indicators
- Automatically refreshing stock scanner
- Market replay with ability to replay across multiple chart windows
- Fast, multi-threaded backtesting with interactive charts
Cons
- Data feed requires subscription to compatible brokerage
- Expensive subscription
- Library of indicators, signals, and functions is not searchable


